
Algebra: Types of Relationships Extended Response Quiz 5
Complete the Quiz Below
Algebra: Types of Relationships Extended Response Quiz 5
Quiz Summary
0 of 10 Questions completed
Questions:
Information
You have already completed the quiz before. Hence you can not start it again.
Quiz is loading…
You must sign in or sign up to start the quiz.
You must first complete the following:
Results
Results
0 of 10 Questions answered correctly
Your time:
Time has elapsed
You have reached 0 of 0 point(s), (0)
Earned Point(s): 0 of 0, (0)
0 Essay(s) Pending (Possible Point(s): 0)
| Average score |
|
| Your score |
|
Categories
- h 0%
| Pos. | Name | Entered on | Points | Result |
|---|---|---|---|---|
| Table is loading | ||||
| No data available | ||||
- 1
- 2
- 3
- 4
- 5
- 6
- 7
- 8
- 9
- 10
- Current
- Review
- Answered
- Correct
- Incorrect
-
Question 1 of 10
1. Question
1 point(s)The cost of hiring an open space for a music festival is $120 000. The cost will be equally shared by the people attending the festival, so that C (in dollars) is the cost per person when n people attend the festival.
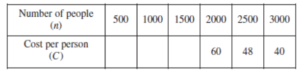
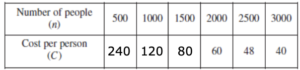
(i) Complete the table by filling in the THREE missing values. (1 mark)
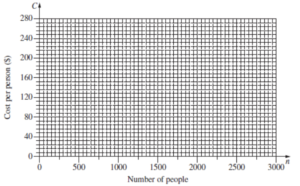
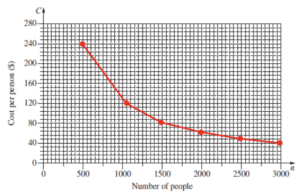
(ii) Using the values from the table, draw the graph showing the relationship between n and C. (2 marks)
(iii) What equation represents the relationship between n and C? (1 mark)
(iv) Give ONE limitation of this equation in relation to this context. (1 mark)
(v) Is it possible for the cost per person to be $94? Support your answer with appropriate calculations. (1 mark)-
This response will be awarded full points automatically, but it can be reviewed and adjusted after submission.
Hint
(i)
(ii)
(iii) C = 120,000/n
(iv) The size of the open space would be limited – so that the value of n would be restricted.
(v) Let C = 94:
94 = 120,000/n
94n = 120 000
n =1276.595745…
No, the number of people n must be a whole number. -
-
Question 2 of 10
2. Question
1 point(s)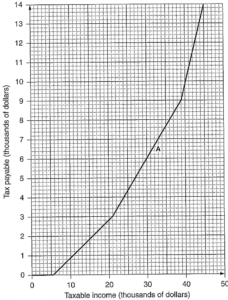
The graph shows tax payable against taxable income, in thousands of dollars.
(i) Use the graph to find tax payable on a taxable income of $21 000. (1 mark)
(ii) Use suitable points from the graph to show that the gradient of the section of the graph marked A is 1/3. (1 mark)
(iii) How much of each dollar earned between $21 000 and $39 000 is payable in tax? (1 mark)
(iv) Write an equation that could be used to calculate the tax payable, T, in terms of the taxable income, I, for taxable incomes between $21 000 and $39 000. (2 marks)-
This response will be awarded full points automatically, but it can be reviewed and adjusted after submission.
Hint
(i) From the graph, $3000
(ii) Choose the two points as (30 000, 6000) and (21 000, 3000)
Gradient = rise/run
= 3000/9000
= 1/3
(iii) One third of every dollar.
(iv) Remember how a tax table is written:
$3000 plus a third of very dollar above $21 000
therefore, T = 3000 + 1/3 [I – 21 000]
= (1/3)I – 4000 -
-
Question 3 of 10
3. Question
1 point(s)The cost of a jewellery box varies directly with the cube of its height.
A jewellery box with a height of 10 cm costs $50.
Calculate the cost of a jewellery box with a height of 12 cm. (2 marks)-
This response will be awarded full points automatically, but it can be reviewed and adjusted after submission.
Hint
Let C = cost and h = height.
C = kh^3
50 = k(10)^3
1000k = 50
k = 1/20
therfore, C = h^3/20
Substitute h = 12:
C = 120^3/20
= 86.4
therefore, the cost is $86.40. -
-
Question 4 of 10
4. Question
1 point(s)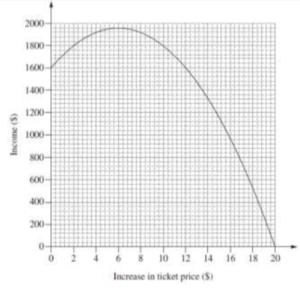
A movie theatre has 200 seats. Each ticket currently costs $8. The theatre owners are currently selling all 200 tickets for each session. They decide to increase the price of tickets to see if they can increase the income earned from each movie session. It is assumed that for one dollar increasein ticket price, there will be 10 fewer tickets sold. A graph showing the relationship between an increase in ticket prices and the income is shown.
(i) What ticket price should be charged to maximise the income from a movie session? (1 mark)
(ii) What is the number of tickets sold when the income is maximised? (1 mark)-
This response will be awarded full points automatically, but it can be reviewed and adjusted after submission.
Hint
(i) From the graph, the price should rise by $6.
As 8 + 6 = 14, this means the ticket price should rise to $14.
(ii) An increase of $1 means 10 fewer tickets.
therefore, an increase of $6 means 60 fewer tickets sold.
As 200 – 60 = 140, there will be 140 tickets sold.
(iii) Income = 14 × 140
= 1960
Cost = 500 + 2 × 140
= 780
Profit = 1960 – 780
= 1180
therefore, the profit is $1180. -
-
Question 5 of 10
5. Question
1 point(s)The mass M kg of a baby pig at age x days is given byM = A(1.1)^x where A is a constant. The graph of this equation is shown.
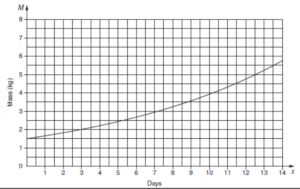
(i) What is the value of A? (2 marks)
(ii) What is the daily growth rate of the pig’s mass.Write your answer as a percentage. (1 mark)-
This response will be awarded full points automatically, but it can be reviewed and adjusted after submission.
Hint
(i) According to the graph, when the pig is born, at age x = 0, it has a mass of 1.5 kg.
This means M = 1.5 when x = 0.
Substitute into M = A(1.1)^x:
1.5 = A(1.1)^0
As, (1.1)^0 = 1, then A = 1.5.
(ii) therefore, M = 1.5(1.1)^x
As multiplying by 1.1 is increasing the mass by 10%, the daily growth rate is 10%. -
-
Question 6 of 10
6. Question
1 point(s)A charity seeks to raise money by telephoning people at random from a call centre and asking them to donate. Over the years, this charity has found that the amount of money raised ($A) is related to the number of telephone calls made (n). A graph of this relationship is shown.It costs the charity $2100 per week to run the call centre. It also costs an average of 50 cents per telephone call.
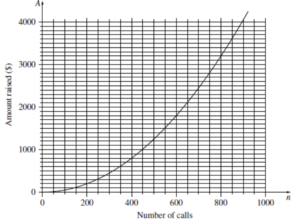
(i) Write an equation to represent the total cost, C, of running the call centre for a week in which n phone calls are made. (1 mark)
(ii) By graphing this equation on the axes above, determine the number of phone calls the charity needs to make in order to break even? (2 marks)-
This response will be awarded full points automatically, but it can be reviewed and adjusted after submission.
Hint
(i) C = 2100 + 0.5n
(ii) Substitute n = 1000:
C = 2100 + 0.5n
C = 2100 + 0.5(1000)
= 2600
From the graph, the point of intersection is at n = 700.
therefore, the charity needs to make 700 phone calls. -
-
Question 7 of 10
7. Question
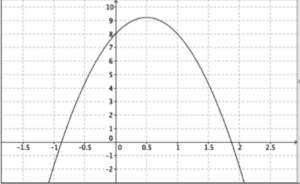
1 point(s)A diver springs upwards from a diving board, then plunges into the water. The diver’s height above the water as it varies with time is modelled by a quadratic function. Graphing software is used to produce the graph of this function. Explain how the graph could be used to determine how high above the height of the diving board the diver was when he reached his maximum height. (2 marks)
-
This response will be awarded full points automatically, but it can be reviewed and adjusted after submission.
Hint
The time is represented on the horizontal axis and the height is represented on the vertical axis. The point where the curve cuts the vertical axis represents the height of the diving board. The point where the curve reaches a maximum represents the maximum height of the diver. The vertical difference between these two positions represents the height above the board reached by the diver. This height is about 1.2 metres.
-
-
Question 8 of 10
8. Question
1 point(s)Continues from part (i) where the capacity of a tank is found to be 2862 L.
The tank was found to be leaking, losing 5% of its volume each day. The volume of the
water remaining in the tank after it began leaking can be modelled using the equation
V = b(0.95)^n where
V is the volume of the water remaining in the tank
b is the volume of the tank when it began leaking
n is the number of days since the tank began leaking
The tank was initially full.
How much water had the tank lost three weeks after it began leaking?
Assume no water was added during these three weeks. (2 marks)-
This response will be awarded full points automatically, but it can be reviewed and adjusted after submission.
Hint
b = 2862 and n = 21
V = b(0.95)^n
V = 2862(0.95)^21
= 974.6873744 …
= 975 (nearest whole)
Lost water = 2862 – 975
= 1887
therefore, 1887 litres lost -
-
Question 9 of 10
9. Question
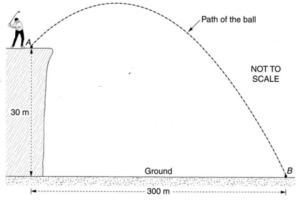
1 point(s)A golf ball is hit from point A to point B, which is on the ground as shown. Point A is 30 metre above the ground and the horizontal distance from point A to point B is 300 m. The path of the ball is modelled using the equation h = 30 + 0.2d – 0.001d^2 where h is the height of the golf ball above the ground in metres, and d is the horizontal distance of the golf ball from point A in metres. The graph of this equation is drawn opposite.
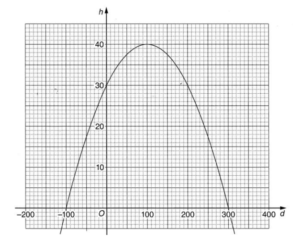
(i) What is the maximum height the ball reaches above the ground?
(ii) There are two occasions when the golf ball is at a height of 35 metres. What horizontal distance does the ball travel in the period between these two occasions?
(iii) What is the height of the ball above the ground when it still has to travel a horizontal distance of 50 metres to hit the ground at point B?
(iv) Only part of the graph applies to this model. Find all values of d that are not suitable to use with this model, and explain why these values are not suitable.-
This response will be awarded full points automatically, but it can be reviewed and adjusted after submission.
Hint
(i) A maximum height of 40 metres
(ii) First after 30 metres, and then
after 170 metres.
Distance = 170 – 30
= 140
therefore, the distance is 140 metres
(iii) 300 – 50 = 250
At 250 metres, the ball is at a height of 17.5 metres
(iv) d < 0 is not suitable as the distance must be positive. Also, d > 300 is not suitable as the ball stops after 300 metres.
therefore, d < 0 and d > 300 are unsuitable -
-
Question 10 of 10
10. Question
1 point(s)In 2010, the city of Thagoras modelled the predicted population of the city using the equation P = A(1.04)^n. That year, the city introduced a policy to slow its population growth. The new predicted population was modelled using the equation P = A(b)^n. In
both equations, P is the predicted population and n is the number of years after 2010. The graph shows the two predicted populations.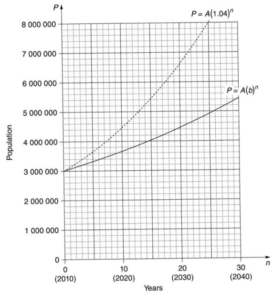
(i) Use the graph to find the predicted population of Thagoras in 2030 if the population policy had NOT been introduced. (1 mark)
(ii) In each of the two equations given, the value of A is 3 000 000. What does A represent? (1 mark)
(iii) The guess-and-check method is to be used to find the value of b, in P = A(b)^n.
(1) Explain, with or without calculations, why 1.05 is not a suitable first estimate for b. (1 mark)
(2) With n = 20 and P = 4 460 000, use the guess-and-check method and the equation P = A(b)^n to estimate the value of b to two decimal places. Show at least TWO estimate values for b, including calculations and conclusions. (2 marks)
(iv) The city of Thagoras was aiming to have a population under 7 000 000 in 2050. Does the model indicate that the city will achieve this aim? Justify your answer with suitable calculations. (2 marks)-
This response will be awarded full points automatically, but it can be reviewed and adjusted after submission.
Hint
(i) 6 600 000
(ii) The population in 2010
(iii) (1) The graph is not as steep as the dotted line. This means that b is less than 1.04, not bigger.
therefore, As 1.05 is bigger than 1.04 it is not a suitable estimate.
(2) P = A(b)^n
4 460 000 = 3 000 000(b)^20
Let b = 1.01:
4 460 000 = 3 000 000(1.01)^20 ?
= 3 660 570 … too low
Let b = 1.02:
4 460 000 = 3 000 000(1.02)^20 ?
= 4 457 842 … too low
Let b = 1.03:
4 460 000 = 3 000 000(1.03)^20 ?
= 5 418 334 … too high
therefore, b = 1.02 is the best estimate
(iv) In 2050, n = 40, P = 7 000 000
therefore, 7 000 000 = 3 000 000(b)^40
b^40 = 7/3
Using results from part (iii)(2):
Consider 1.02: 1.02^40 = 2.208 < 7/3 Consider 1.03: 1.03^40 = 3.262 > 7/3
therefore, possible that population under 7 000 000 -